AAVE Market Analysis: Mixed Order Flow
AAVE fell 10.26% as trading activity accelerated, but mixed aggressive flow limits conviction. Examine the volume, flow, persistence and order-book evidence.
Get more AirdropBuzz stories on Google
Add AirdropBuzz as a preferred source so Google can highlight more of our airdrop guides, safety updates, and market research for you.
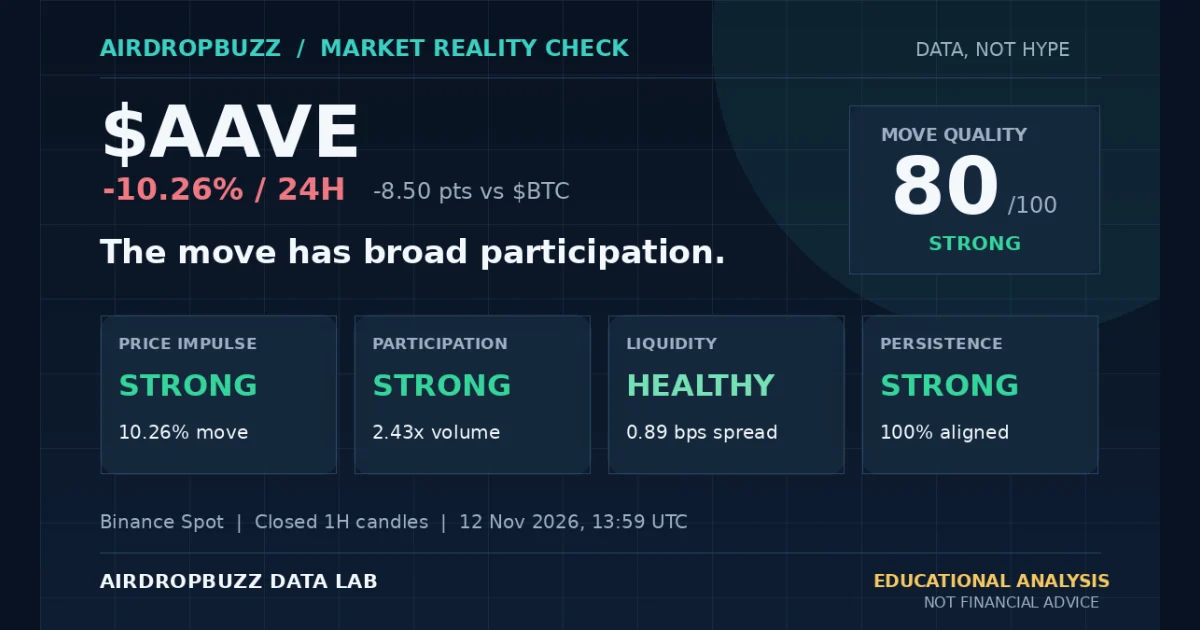
This AAVE market analysis examines whether the latest 10.26% 24-hour decline is supported by trading activity, aggressive flow, persistence and visible liquidity.
$AAVE fell 10.26% over the latest 24 closed hourly candles and lagged $BTC by 8.50 percentage points. This snapshot compares that move with recorded spot trading activity and visible liquidity.
The Quick Read
The move has broad participation. The Move Quality score is 80/100, classified as Strong.
Participation Check
The six-hour mean hourly quote volume is 2.43x its earlier-hour median baseline, which is well above its recent hourly baseline. Mean hourly trade count is 1.76x baseline, so trade activity is above its recent hourly baseline. During the same six-hour sample, taker buys represented 51.8% of quote volume; aggressive order flow remained close to balanced. These are spot-market observations, not on-chain wallet or holder measurements.
Move Quality
Price, volume and trade activity are pointing in broadly the same direction. That makes the move more internally consistent than a one-candle spike supported by thin turnover. Directional persistence was 100% across the six most recent closed hourly candles.
Liquidity Check
The observed bid-ask spread was 0.89 basis points. Balanced visible depth within 0.5% of price was approximately $89.6K. The move deserves extra caution because available depth or spread quality was less convincing than the headline activity.
Counterpoint
Broad participation can fade after the snapshot. Later deterioration in the weaker components would challenge the apparent support. The lowest recorded component score here is aggressive-flow alignment.
What Would Change This Reading?
A stronger reading would require price activity, turnover and trade breadth to remain aligned across several closed candles. A weaker reading would appear if the headline move continues while volume, trade count or balanced depth deteriorates. This framework evaluates participation quality; it is not a prediction of the next candle.
What To Watch Next
Watch whether aggressive spot flow stays aligned with the recorded price move. A shift against that move would weaken the reading.
Your Take
Which change in aggressive spot flow would make you reassess this move?
Method: AirdropBuzz Data Lab Reality Check v1.0.0 compares price impulse with volume, trade breadth, taker flow, persistence and visible liquidity using fixed rules.
Data: Binance Spot closed 1H candles, 24H ticker and an order-book sample. Candle data as of 2026-11-12 13:59 UTC. The order book is a separate point-in-time observation, not a guarantee of execution liquidity. Educational analysis only; not financial advice.
Reader discussion
Add useful context, questions or a different reading of the data.
Have something useful to add?
Sign in to comment. Requiring an AirdropBuzz account helps keep spam and wallet scams out of the discussion.
Sign in to comment
No comments yet. Be the first reader to add useful context.