
RAY Market Analysis: Fragile Liquidity
RAY rose 64.64% as trading activity accelerated, but fragile liquidity leaves the move uneven. Examine the volume, flow, persistence and order-book evidence.
Read the analysis →Long-form, rule-based analysis that looks beyond the headline price move. Each article compares activity, flow, persistence and liquidity, then links back to the relevant live Market Pulse context.
RAY rose 64.64% as trading activity accelerated, but fragile liquidity leaves the move uneven. Examine the volume, flow, persistence and order-book evidence.
Read the analysis →
SUSHI market analysis compares the latest 24-hour move with volume, trade breadth, flow and liquidity. See whether participation supports follow-through.
Read the analysis →
ZEN rose 21.48% as trading activity accelerated, but mixed aggressive flow limits conviction. Examine the volume, flow, persistence and order-book evidence.
Read the analysis →
PROM rose 11.45% as trading activity accelerated, but mixed aggressive flow limits conviction. Examine the volume, flow, persistence and order-book evidence.
Read the analysis →
CHIP rose 30.10% as trading activity accelerated, but fragile liquidity leaves the move uneven. Examine the volume, flow, persistence and order-book evidence.
Read the analysis →
MUBARAK market analysis compares the latest 24-hour move with volume, trade breadth, flow and liquidity. See whether participation supports follow-through.
Read the analysis →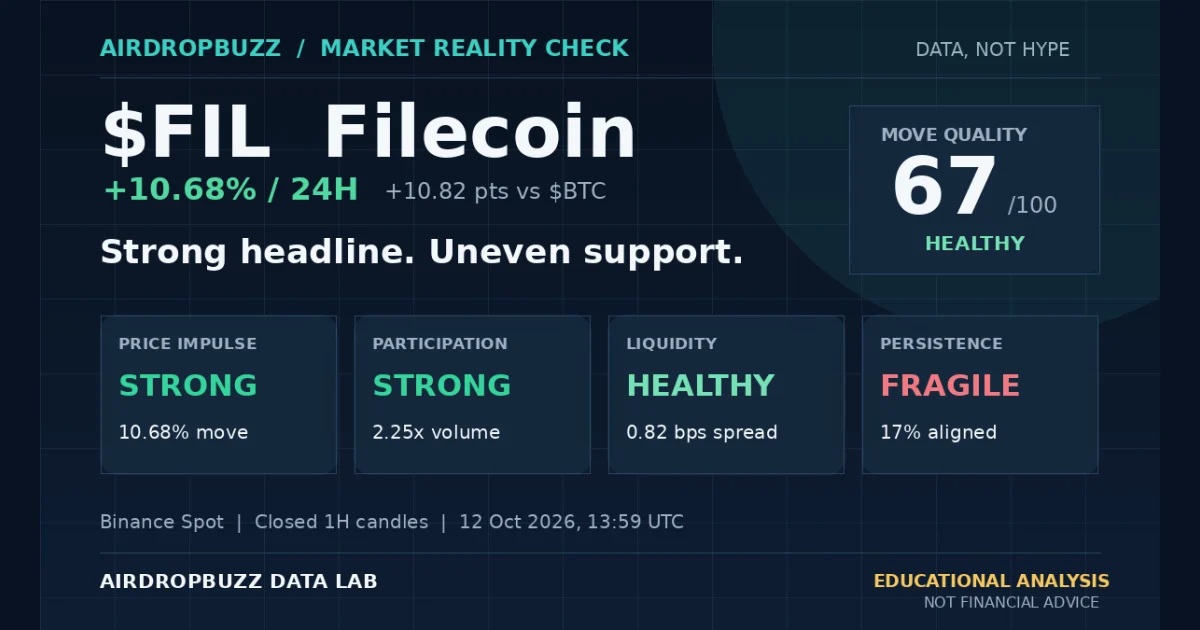
FIL market analysis compares the latest 24-hour move with volume, trade breadth, flow and liquidity. See whether participation supports follow-through.
Read the analysis →
ACE rose 24.91% as trading activity accelerated, but mixed aggressive flow limits conviction. Examine the volume, flow, persistence and order-book evidence.
Read the analysis →
NEAR market analysis compares the latest 24-hour move with volume, trade breadth, flow and liquidity. See whether participation supports follow-through.
Read the analysis →